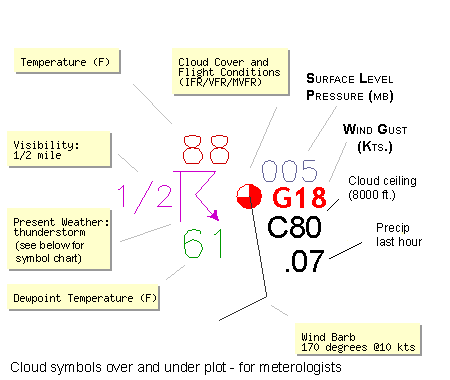
Here is a graphic showing a breakdown of the plots.
Surface Data Plot
The surface data plot gives the following information:

| Data | Description |
| temperature (F) | plotted upper left |
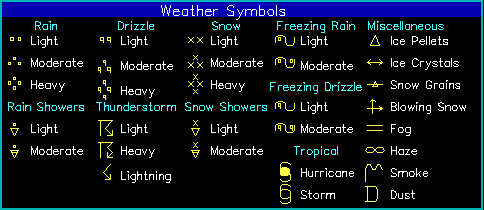
| present weather | symbol plotted center left (see below) |
| dewpoint (F) | plotted lower left |
| pressure (.1 mb-coded) | plotted upper right as last 3 digits (987=998.7mb, 024=1002.4mb) |
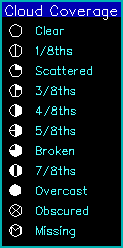
| cloud cover | center circle. white fill indicates % cloud coverage (see below) |
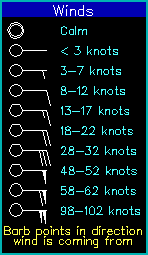
| winds | wind barb (see below) |
Weather Symbols


